
Numpy & Pandas & Matplotilb 部分 API 操作
Numpy
导入
import numpy as np
API
创建数组
np.array([10, 11, 12, 13])# [10 11 12 13]

np.array([10, 11, 12, 13, 14 ,15]).reshape([2,3])# [#   [10 11 12]#   [13 14 15]# ]

np.array([[1, 2], [3, 4]])# [#   [1 2]#   [3 4]# ]

np.arange(4)# [0 1 2 3]

np.arange(2, 6)# [2 3 4 5]

np.arange(4).reshape([2,2])# [#   [0 1]#   [2 3]# ]

np.random.random([2,3])# [#   [ 0.00136044  0.46854718  0.59149907]#   [ 0.75636339  0.18204628  0.53191402]# ]
求值
arr = np.array([10, 11, 12, 13, 14 ,15]).reshape([2,3])# [#   [10 11 12]#   [13 14 15]# ]

# 总数np.sum(arr, axis=0)# [23 25 27]np.sum(arr, axis=1)# [33 42]

# 最小数np.min(arr, axis=0)# [10 11 12]np.min(arr, axis=1)# [10 13]

# 最大数np.max(arr, axis=0)# [13 14 15]np.max(arr, axis=1)# [12 15]

# 最大/小值得索引值np.argmin(arr)# 0 0 是索引np.argmax(arr)# 5 5 是索引

# 平均值arr.mean()# np.mean(arr)# 12.5np.average(arr)# 12.5

# 逐步增加np.cumsum(arr)# [10 21 33 46 60 75]

# 相差np.diff(arr)# [#   [1 1]#   [1 1]# ]
# 替换np.clip(arr, 11, 14)# [#   [11 11 12]#    [13 14 14]# ]# 小于 11 的数替换成 11,大于 14 的数替换成 14,其他数不变
索引
arr = np.arange(3, 15).reshape([3,4])# [#   [ 3  4  5  6]#   [ 7  8  9 10]#   [11 12 13 14]# ]
arr[1, 1]# arr[1][1]# 8
arr[:, 1]# [ 4 8 12]
arr[1, :]# [ 7 8 9 10]
arr[1, 1:3]# [8 9]
arr.flatten()# [ 3  4  5  6  7  8  9 10 11 12 13 14]
for i in arr.flat:  print(i)# 每行打印出值。arr.flat 是迭代器
合并
A = np.array([1, 1, 1])B = np.array([2, 2, 2])
np.vstack((A, B))# [#   [1 1 1]#   [2 2 2]# ]np.hstack((A, B))# [1 1 1 2 2 2]
分割
arr = np.arange(12).reshape([3,4])# [#   [ 0  1  2  3]#   [ 4  5  6  7]#   [ 8  9 10 11]# ]
np.split(arr, 2, axis=1)# [array([#   [0, 1],#   [4, 5],#   [8, 9]# ]),# array([#   [ 2,  3],#   [ 6,  7],#   [10, 11]]# )]
Pandas
导入
import pandas as pd
API
创建列表
pd.Series([1, 3, 6, np.nan, 44, 1])# 0     1.0# 1     3.0# 2     6.0# 3     NaN# 4    44.0# 5     1.0# dtype: float64

pd.date_range('20171108', periods=6)# DatetimeIndex(#   ['2017-11-08', '2017-11-09', '2017-11-10', '2017-11-11','2017-11-12', '2017-11-13'],#   dtype='datetime64[ns]',#   freq='D'# )

dates = pd.date_range('20171108', periods=6)pd.DataFrame(np.random.randn(6, 4), index=dates, columns=['a', 'b', 'c', 'd'])#                    a         b         c         d# 2017-11-08  0.644350  1.122020 -1.263401  0.163371# 2017-11-09  0.573329 -0.242054 -0.342220  1.070905# 2017-11-10  0.714291 -0.721509 -2.298672 -0.513572# 2017-11-11 -0.614927  2.010482 -1.369179 -0.901276# 2017-11-12  0.709672 -0.430620  1.070244 -2.308874# 2017-11-13  1.284080  1.169807  1.668942  0.859300

pd.DataFrame({  'A': 1.,  'B': pd.Timestamp('20171108'),  'C': pd.Series(1, index=list(range(4)), dtype='float32'),  'D': np.array([3] * 4, dtype='int32'),  'E': pd.Categorical(['test', 'train', 'test', 'train']),  'F': 'foo'})#      A          B    C  D      E    F# 0  1.0 2017-11-08  1.0  3   test  foo# 1  1.0 2017-11-08  1.0  3  train  foo# 2  1.0 2017-11-08  1.0  3   test  foo# 3  1.0 2017-11-08  1.0  3  train  foo
选择获取
datas = pd.DataFrame({  'A': 1.,  'B': pd.Timestamp('20171108'),  'C': pd.Series(1, index=list(range(4)), dtype='float32'),  'D': np.array([3] * 4, dtype='int32'),  'E': pd.Categorical(['test', 'train', 'test', 'train']),  'F': 'foo'})#     A          B    C  D      E    F# 0  1.0 2017-11-08  1.0  3   test  foo# 1  1.0 2017-11-08  1.0  3  train  foo# 2  1.0 2017-11-08  1.0  3   test  foo# 3  1.0 2017-11-08  1.0  3  train  foo
datas.A# datas['A']# 0    1.0# 1    1.0# 2    1.0# 3    1.0# Name: A, dtype: float64
datas[0:3]#      A          B    C  D      E    F# 0  1.0 2017-11-08  1.0  3   test  foo# 1  1.0 2017-11-08  1.0  3  train  foo# 2  1.0 2017-11-08  1.0  3   test  foo
datas.loc[0]# 当 index 是类似'2017-11-8 的时候',datas.loc['20171108']# A                      1# B    2017-11-08 00:00:00# C                      1# D                      3# E                   test# F                    foo# Name: 0, dtype: object
datas.loc[:,['A', 'B']]#      A          B# 0  1.0 2017-11-08# 1  1.0 2017-11-08# 2  1.0 2017-11-08# 3  1.0 2017-11-08
datas.loc[[1, 3],['A', 'B']]#      A          B# 1  1.0 2017-11-08# 3  1.0 2017-11-08
# icol 是基于行号获取的,col 是基于 index 获取的,ix 是他们俩的混合 (index、行号都可以)# icol[1]# ix[1]# 当 index 为 2017-11-08 时,ix['20171108']
datas[datas.E == 'test']#               A          B    C  D     E    F# 2017-11-08  1.0 2017-11-08  1.0  3  test  foo# 2017-11-10  1.0 2017-11-08  1.0  3  test  foo
datas.index# Int64Index([0, 1, 2, 3], dtype='int64')
datas.columns# Index([u'A', u'B', u'C', u'D', u'E', u'F'], dtype='object')
datas.values# array(# [#   [1.0, Timestamp('2017-11-08 00:00:00'), 1.0, 3, 'test', 'foo'],#   [1.0, Timestamp('2017-11-08 00:00:00'), 1.0, 3, 'train', 'foo'],#   [1.0, Timestamp('2017-11-08 00:00:00'), 1.0, 3, 'test', 'foo'],#   [1.0, Timestamp('2017-11-08 00:00:00'), 1.0, 3, 'train', 'foo']# ],# dtype=object)
排序
datas.sort_index(axis=0, ascending=False)#      F      E  D    C          B    A# 0  foo   test  3  1.0 2017-11-08  1.0# 1  foo  train  3  1.0 2017-11-08  1.0# 2  foo   test  3  1.0 2017-11-08  1.0# 3  foo  train  3  1.0 2017-11-08  1.0
datas.sort_index(axis=0, ascending=False)#      A          B    C  D      E    F# 3  1.0 2017-11-08  1.0  3  train  foo# 2  1.0 2017-11-08  1.0  3   test  foo# 1  1.0 2017-11-08  1.0  3  train  foo# 0  1.0 2017-11-08  1.0  3   test  foo
datas.sort_values(by='E')#      A          B    C  D      E    F# 0  1.0 2017-11-08  1.0  3   test  foo# 2  1.0 2017-11-08  1.0  3   test  foo# 1  1.0 2017-11-08  1.0  3  train  foo# 3  1.0 2017-11-08  1.0  3  train  foo
设置值
datas = pd.DataFrame({  'A': pd.Series([1, 5, 'test', 'foo'], index=list(range(4))),  'B': pd.Series([np.nan, 1, np.nan, 'test'], index=list(range(4))),  'C': pd.Series(1, index=list(range(4)), dtype='float32'),})#       A     B    C# 0     1   NaN  1.0# 1     5     1  1.0# 2  test   NaN  1.0# 3   foo  test  1.0
datas.dropna(axis=0, how='any')# 当 axis 是 1 时,则判断竖向里是否含有 NaN 的值# how = 'any' || 'all' 默认是 any# 当是 any 的时候,有一个值是 NaN 的时,就删除这一行。# 当时 all 的时候,这一行全部为 NaN 时,就删除这一行#      A     B    C# 1    5     1  1.0# 3  foo  test  1.0
datas.fillna(value=0)#       A     B    C# 0     1     0  1.0# 1     5     1  1.0# 2  test     0  1.0# 3   foo  test  1.0
datas.isnull()#        A      B      C# 0  False   True  False# 1  False  False  False# 2  False   True  False# 3  False  False  False
# 当数据特别大的时候,或者只想判断是否有值是 NaN 的值时# np.any(datas.isnull()) == True#   当有值时 NaN 时,将返回 True
导入导出
pd.read_csv('***.csv',delimiter=',',encoding='utf-8',names=['test1','test2','test3'])# 参数一: 读取的目标文件# 参数二: csv 文件的分隔符# 参数三: 编码# 参数四: 设置列名
#           test1     test2          test3# 0    2017-11-18       ABC        51315.0# 1    2017-11-19       DEF         5659.0# 2    2017-11-20       GHI         1599.0# 3    2017-11-21       JKL         2224.0
datas.to_csv('**.csv')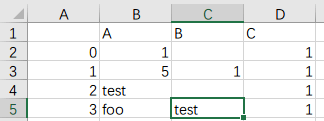
合并
concat
datas1 = pd.DataFrame(np.ones((3, 4)) * 0, columns=['a', 'b', 'c', 'd'])#      a    b    c    d# 0  0.0  0.0  0.0  0.0# 1  0.0  0.0  0.0  0.0# 2  0.0  0.0  0.0  0.0
datas2 = pd.DataFrame(np.ones((3, 4)) * 1, columns=['a', 'b', 'c', 'd'])#      a    b    c    d# 0  1.0  1.0  1.0  1.0# 1  1.0  1.0  1.0  1.0# 2  1.0  1.0  1.0  1.0
datas3 = pd.DataFrame(np.ones((3, 4)) * 2, columns=['a', 'b', 'c', 'd'])#      a    b    c    d# 0  2.0  2.0  2.0  2.0# 1  2.0  2.0  2.0  2.0# 2  2.0  2.0  2.0  2.0
pd.concat([datas1, datas2, datas3], axis=0, ignore_index=True)#      a    b    c    d# 0  0.0  0.0  0.0  0.0# 1  0.0  0.0  0.0  0.0# 2  0.0  0.0  0.0  0.0# 3  1.0  1.0  1.0  1.0# 4  1.0  1.0  1.0  1.0# 5  1.0  1.0  1.0  1.0# 6  2.0  2.0  2.0  2.0# 7  2.0  2.0  2.0  2.0# 8  2.0  2.0  2.0  2.0
pd.concat([datas1, datas2, datas3], axis=1)#      a    b    c    d    a    b    c    d    a    b    c    d# 0  0.0  0.0  0.0  0.0  1.0  1.0  1.0  1.0  2.0  2.0  2.0  2.0# 1  0.0  0.0  0.0  0.0  1.0  1.0  1.0  1.0  2.0  2.0  2.0  2.0# 2  0.0  0.0  0.0  0.0  1.0  1.0  1.0  1.0  2.0  2.0  2.0  2.0
concat 部分参数
在 concat 里,join 的默认参数时 outer
datas1 = pd.DataFrame(np.ones((3, 4)) * 0, columns=['a', 'b', 'c', 'd'], index=[1, 2, 3])#      a    b    c    d# 1  0.0  0.0  0.0  0.0# 2  0.0  0.0  0.0  0.0# 3  0.0  0.0  0.0  0.0
datas2 = pd.DataFrame(np.ones((3, 4)) * 1, columns=['b', 'c', 'd', 'e'], index=[2, 3, 4])#      b    c    d    e# 2  1.0  1.0  1.0  1.0# 3  1.0  1.0  1.0  1.0# 4  1.0  1.0  1.0  1.0
pd.concat([datas1, datas2], join='outer')#      a    b    c    d    e# 1  0.0  0.0  0.0  0.0  NaN# 2  0.0  0.0  0.0  0.0  NaN# 3  0.0  0.0  0.0  0.0  NaN# 2  NaN  1.0  1.0  1.0  1.0# 3  NaN  1.0  1.0  1.0  1.0# 4  NaN  1.0  1.0  1.0  1.0
pd.concat([datas1, datas2], join='inner')#      b    c    d# 1  0.0  0.0  0.0# 2  0.0  0.0  0.0# 3  0.0  0.0  0.0# 2  1.0  1.0  1.0# 3  1.0  1.0  1.0# 4  1.0  1.0  1.0
pd.concat([datas1, datas2], axis=1, join_axes=[datas2.index])#      a    b    c    d    b    c    d    e# 2  0.0  0.0  0.0  0.0  1.0  1.0  1.0  1.0# 3  0.0  0.0  0.0  0.0  1.0  1.0  1.0  1.0# 4  NaN  NaN  NaN  NaN  1.0  1.0  1.0  1.0# 如果没有 join_axes 值时:#      a    b    c    d    b    c    d    e# 1  0.0  0.0  0.0  0.0  NaN  NaN  NaN  NaN# 2  0.0  0.0  0.0  0.0  1.0  1.0  1.0  1.0# 3  0.0  0.0  0.0  0.0  1.0  1.0  1.0  1.0# 4  NaN  NaN  NaN  NaN  1.0  1.0  1.0  1.0
append
datas1 = pd.DataFrame(np.ones((3, 4)) * 0, columns=['a', 'b', 'c', 'd'])#      a    b    c    d# 0  0.0  0.0  0.0  0.0# 1  0.0  0.0  0.0  0.0# 2  0.0  0.0  0.0  0.0
datas2 = pd.Series([1, 2, 3, 4], index=['a', 'b', 'c', 'd'])# a    1# b    2# c    3# d    4# dtype: int64
datas1.append(datas2, ignore_index=True)#      a    b    c    d# 0  0.0  0.0  0.0  0.0# 1  0.0  0.0  0.0  0.0# 2  0.0  0.0  0.0  0.0# 3  1.0  2.0  3.0  4.0
merge
left = pd.DataFrame({  'key': ['k0', 'k1', 'k2', 'k3'],  'A': ['A0', 'A1', 'A2', 'A3'],  'B': ['B0', 'B1', 'B2', 'B3']})#     A   B key# 0  A0  B0  k0# 1  A1  B1  k1# 2  A2  B2  k2# 3  A3  B3  k3
right = pd.DataFrame({  'key': ['k0', 'k1', 'k2', 'k3'],  'C': ['C0', 'C1', 'C2', 'C3'],  'D': ['D0', 'D1', 'D2', 'D3']})#     C   D key# 0  C0  D0  k0# 1  C1  D1  k1# 2  C2  D2  k2# 3  C3  D3  k3
pd.merge(left, right, on='key')#     A   B key   C   D# 0  A0  B0  k0  C0  D0# 1  A1  B1  k1  C1  D1# 2  A2  B2  k2  C2  D2# 3  A3  B3  k3  C3  D3
left = pd.DataFrame({ 'key1': ['k0', 'k0', 'k1', 'k2'], 'key2': ['k0', 'k1', 'k0', 'k1'], 'A': ['A0', 'A1', 'A2', 'A3'], 'B': ['B0', 'B1', 'B2', 'B3']})# A B key1 key2# 0 A0 B0 k0 k0# 1 A1 B1 k0 k1# 2 A2 B2 k1 k0# 3 A3 B3 k2 k1
right = pd.DataFrame({ 'key1': ['k0', 'k1', 'k1', 'k2'], 'key2': ['k0', 'k0', 'k0', 'k0'], 'C': ['C0', 'C1', 'C2', 'C3'], 'D': ['D0', 'D1', 'D2', 'D3']})# C D key1 key2# 0 C0 D0 k0 k0# 1 C1 D1 k1 k0# 2 C2 D2 k1 k0# 3 C3 D3 k2 k0
pd.merge(left, right, on=['key1', 'key2'], how='inner')# how 默认是 inner# A B key1 key2 C D# 0 A0 B0 k0 k0 C0 D0# 1 A2 B2 k1 k0 C1 D1# 2 A2 B2 k1 k0 C2 D2
pd.merge(left, right, on=['key1', 'key2'], how='outer')# A B key1 key2 C D# 0 A0 B0 k0 k0 C0 D0# 1 A1 B1 k0 k1 NaN NaN# 2 A2 B2 k1 k0 C1 D1# 3 A2 B2 k1 k0 C2 D2# 4 A3 B3 k2 k1 NaN NaN# 5 NaN NaN k2 k0 C3 D3
pd.merge(left, right, on=['key1', 'key2']. how='right')# A B key1 key2 C D# 0 A0 B0 k0 k0 C0 D0# 1 A2 B2 k1 k0 C1 D1# 2 A2 B2 k1 k0 C2 D2# 3 NaN NaN k2 k0 C3 D3
pd.merge(left, right, on=['key1', 'key2'], how='left')# A B key1 key2 C D# 0 A0 B0 k0 k0 C0 D0# 1 A1 B1 k0 k1 NaN NaN# 2 A2 B2 k1 k0 C1 D1# 3 A2 B2 k1 k0 C2 D2# 4 A3 B3 k2 k1 NaN NaNmatplotilb
导入
import matplotlib.pyplot as plt
API
plot
data = pd.Series(np.random.randn(1000)) # 随机 1000 个数data = data.cumsum() # 累加# 因为 pandas 本来就是一个数据,所以可以直接 plot,# 还有两种写法: plt.plot(x=,y = ) 或者 plt.plot([xxx,xxx],[yyy,yyy])data.plot()plt.rcParams['font.sans-serif']=['SimHei'] # 用来正常显示中文标签plt.rcParams['axes.unicode_minus']=False # 用来正常显示负号# linewidth 线条的宽度# linestyle 线条风格 (-实线 --破折线 -。点划线 : 虚线 None 说明都不画)plt.plot([1,50,100],[1,4,9], linewidth=2.5, linestyle='--', label='lalala')plt.legend(loc='upper left') # 没有这句,上面的 label 将不会显示plt.plot([1,100,200],[1,7,9]) # 第三个数据plt.title('Demo') # 标题plt.xlabel('xxx') # x 轴名称plt.ylabel('yyy') # y 轴名称plt.text(60, 10, u'说明文字') # 说明文字plt.show() # 显示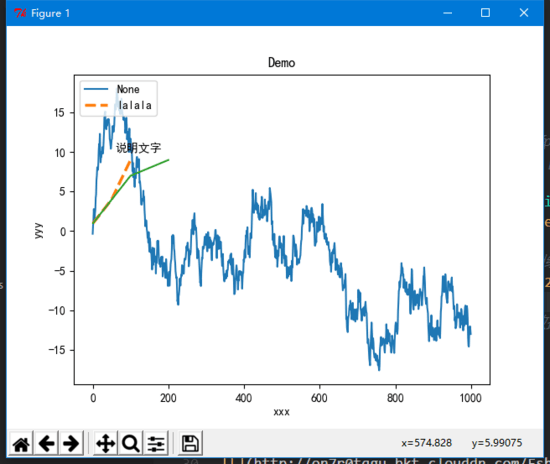
# 随机 1000 行 4 列的数字,行数从 0 到 999,列表为 A B C Ddata = pd.DataFrame(np.random.randn(1000, 4), index=np.arange(1000), columns=list('ABCD'))data = data.cumsum() # 累加data.plot()plt.show()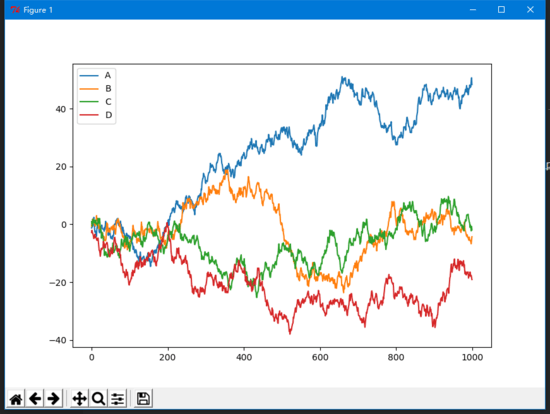
其他图
柱状图
plt.bar(left, height, width=0.8)散点图
plt.scatter(x,y)