
Listen for page crashes with the WebKit remote debugging protocol
Background
I’m working on a project that uses puppeteer. One feature opens multiple Tabs in the Chrome that puppeteer launched, and manages them.
puppeteer can open multiple sites, but that isn’t easy to manage, so I used an extension to open and manage the sites.
I also needed to take some action when a site crashes. I couldn’t find a good way to listen for whether the current site had crashed.
You might say: doesn’t puppeteer provide page.on('error', fn) for this?
Note what I said above: the sites are opened by an extension. puppeteer’s API only works for pages it opened. For pages not opened by puppeteer, page.on('error', fn) does nothing.
Using Service Workers
This idea came from my coworker Haitao (opens in a new tab).
Run a Service Workers on the current site. At runtime Service Workers start a separate process, so the site and Service Workers are two processes. When the site crashes, the Service Workers process is unaffected. You can use a heartbeat to tell if the site crashed.
There’s also an Alibaba article: 如何监控网页崩溃? (opens in a new tab)
I didn’t use this approach. If Service Workers crash, you’re stuck. You might say: have the site and Service Workers heartbeat each other. That could work, but I don’t like it.
Using WebKit’s remote debugging protocol
Introduction
Before we start, look at puppeteer source and why it can listen for page crashes.
The code is in lib/Page.js.
Page is a Class that extends EventEmitter. EventEmitter gives page the on method, which is page.on('error', fn) from earlier.
So somewhere in Page Class it calls this.emit('error') to fire the error event. I searched and found it in _onTargetCrashed:
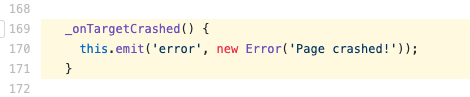
We found the crash trigger. Where is _onTargetCrashed itself triggered?

A client listens for Inspector.targetCrashed, which calls _onTargetCrashed. I won’t follow client further. It jumps around a lot. Just know that client ends up being a websocket. The websocket is created in lib/Launcher.js. Code location (opens in a new tab)
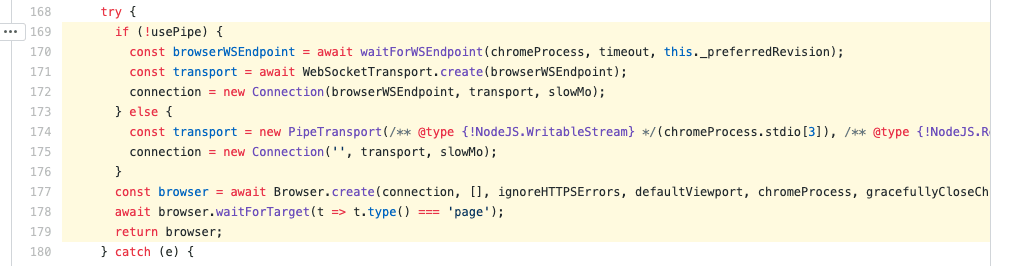
Note these two lines:
const transport = new PipeTransport((chromeProcess.stdio[3]), (chromeProcess.stdio[4]));
connection = new Connection('', transport, slowMo);
chromeProcess is from nodejs spawn:
Code location (opens in a new tab)
const chromeProcess = childProcess.spawn( chromeExecutable, chromeArguments, { detached: process.platform !== 'win32', env, stdio });chromeArguments is the chrome launch argument list. It includes --remote-debugging-:
Code location (opens in a new tab)
if (!chromeArguments.some(argument => argument.startsWith('--remote-debugging-'))) chromeArguments.push(pipe ? '--remote-debugging-pipe' : '--remote-debugging-port=0');It’s much clearer now. Inspector.targetCrashed comes from the WebKit remote debugging protocol, i.e. remote debugging protocol.
It’s defined in WebKit’s Inspector.json: Source/WebCore/inspector/Inspector.json#L39-L42 (opens in a new tab)
The commit for this event: https://github.com/WebKit/webkit/commit/255ba17d1d7e0ad1530d503f28ee5d93d7c5351e#diff-4681ce2c9384e770dfac03ab133f133b (opens in a new tab)
Writing the solution
If we can listen for Inspector.targetCrashed, we know whether the site crashed. Add a launch arg to puppeteer:
puppeteer.launch({ args: [ '--remote-debugging-port=9222' // other args ]});When puppeteer starts, it listens on local port 9222. The path /json is the current details:
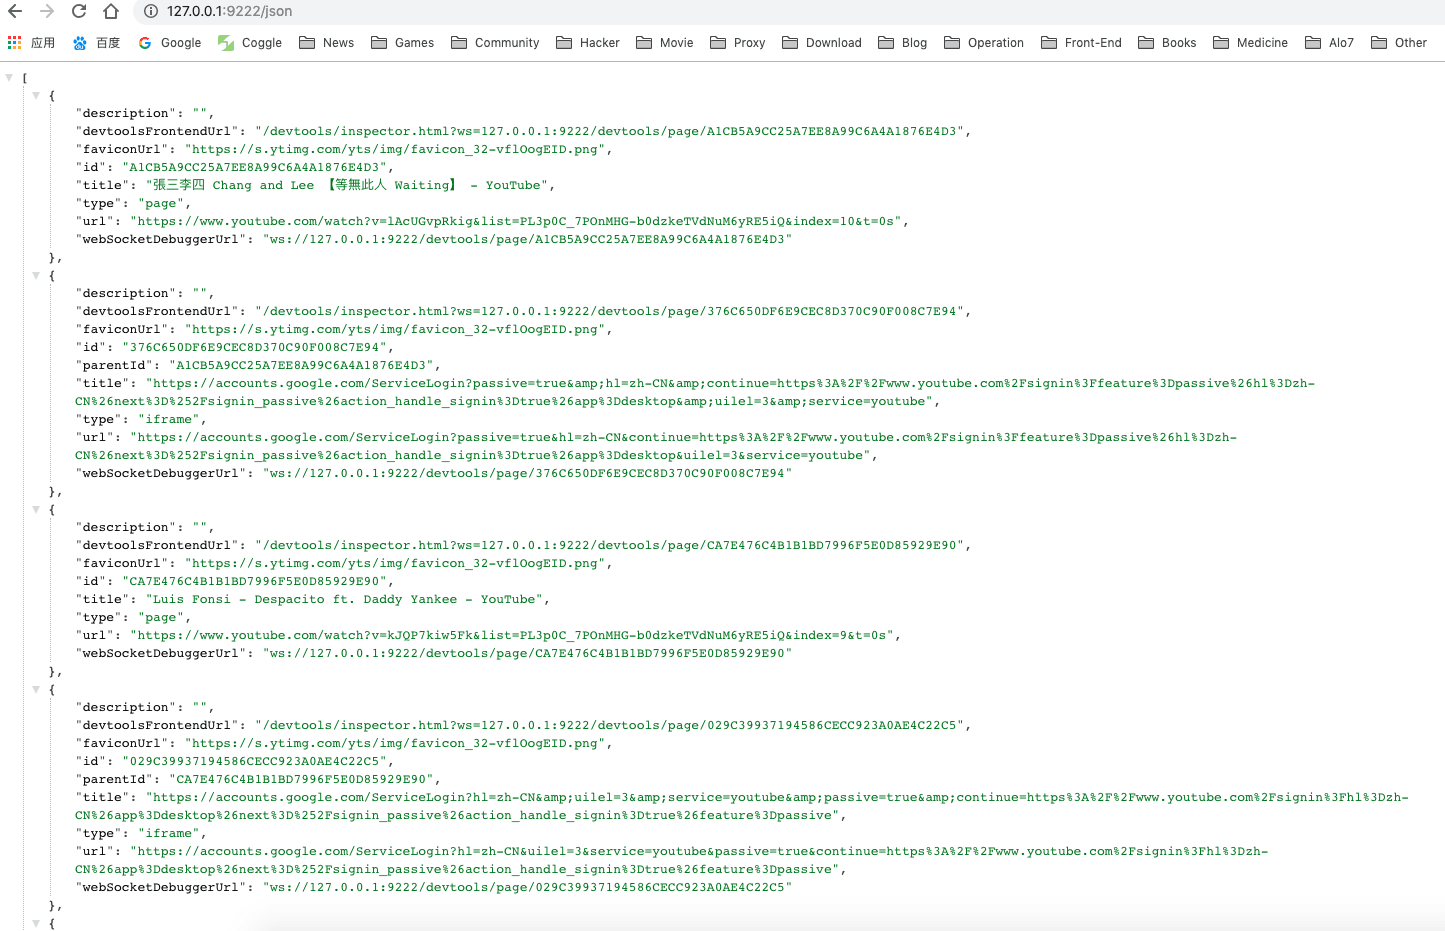
The format is:
[ { "description": "", "devtoolsFrontendUrl": "/devtools/inspector.html?ws=127.0.0.1:9222/devtools/page/A1CB5A9CC25A7EE8A99C6A4A1876E4D3", "faviconUrl": "https://s.ytimg.com/yts/img/favicon_32-vflOogEID.png", "id": "A1CB5A9CC25A7EE8A99C6A4A1876E4D3", "title": "張三李四 Chang and Lee 【等無此人 Waiting】 - YouTube", "type": "page", "url": "https://www.youtube.com/watch?v=lAcUGvpRkig&list=PL3p0C_7POnMHG-b0dzkeTVdNuM6yRE5iQ&index=10&t=0s", "webSocketDebuggerUrl": "ws://127.0.0.1:9222/devtools/page/A1CB5A9CC25A7EE8A99C6A4A1876E4D3" }]type is the current process:
- page: web page
- iframe: iframe nested in a page
- background_page: extension page
- service_worker: Service Workers
type is useful if you only want to listen for a certain kind of crash.
There’s a more important field: webSocketDebuggerUrl. We’ll use it to get messages. A simple demo:
const http =  require('http');const WebSocket = require('ws');
http.get('http://127.0.0.1:9222/json', res => {  res.addListener('data', data => {    const result = JSON.parse(data.toString());    result.forEach(info => {      const client = new WebSocket(info.webSocketDebuggerUrl);      client.on('message', data => {        if (data.indexOf('"method":"Inspector.targetCrashed"') !== -1) {          console.error('crash!');        }      });    });  })})
Understand this first. The later code is easier then. The code is simple enough that I won’t explain it.
One problem: when the extension opens a site there’s a delay, so some sites may not be listened to. And after this code has run, sites the extension opens later also won’t be listened to. I tightened it up:
const http =  require('http');const WebSocket = require('ws');
module.exports = () => {  const wsList = {};  let crashStaus = false;
  const getWsList = () => {    return new Promise((resolve) => {      http.get('http://127.0.0.1:9222/json', res => {        res.addListener('data', data => {          try {            const result = JSON.parse(data.toString());            const tempWsList = {};
            result.forEach(info => {              if (typeof wsList[info.id] === 'undefined') {                tempWsList[info.id] = info.webSocketDebuggerUrl;                wsList[info.id] = info.webSocketDebuggerUrl;              }            });
            if (Object.keys(tempWsList).length !== 0) {              resolve(tempWsList);            }          } catch (e) {            console.error(e);          }        });      });    });  };
  setInterval(() => {    getWsList().then(list => {      Object.values(list).forEach(wsUrl => {        const client = new WebSocket(wsUrl);        client.on('message', data => {          if (data.indexOf('"method":"Inspector.targetCrashed"') !== -1) {            if (!crashStaus) {              crashStaus = true;              console.log('crash!!!');            }          }        });      })    });  }, 1000);};
A note on this snippet:
if (!crashStaus) { crashStaus = true; console.log('crash!!!');}My requirement is: if any process crashes, shut down the whole service and restart. If multiple processes crash at once, I only want this path to run once. That’s specific to my case. Change it to fit yours.
References
A first look at the WebKit remote debugging protocol (opens in a new tab)
Chrome remote debugging protocol: analysis and practice (opens in a new tab)
Reply to this post on X (opens in a new tab)View as Markdown